charts

PPT 2007 Charts (part 5)

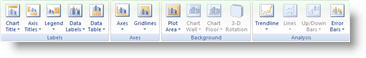
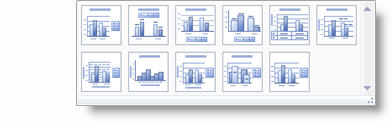
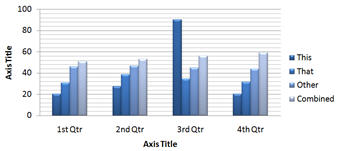
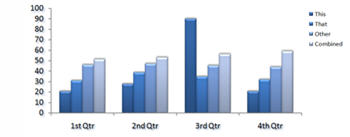
Individual elements can also be adjusted not only with easy, but using the new visual effects. Here I am selecting the horizontal gridlines of the chart. I can go to FORMAT >> SHAPES STYLES >> and choose any of the preset effects and colors:

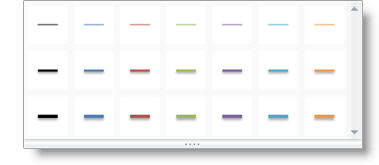
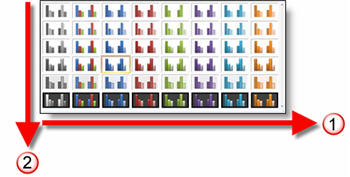
Just like earlier the horizontal options are the colors from the Theme. The vertical options progress from simple/flat to rich/beveled designs.

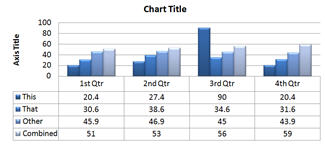
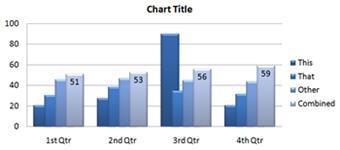
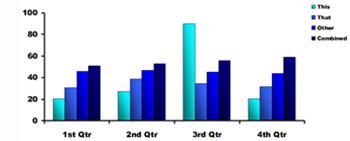
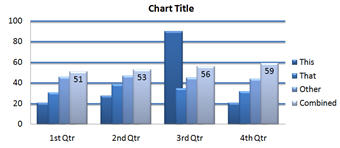
With just a few clicks the gridlines can easily be updated to these:

– Troy @ TLC

By |2016-11-17T13:19:47-07:00March 19th, 2008|PowerPoint, Tutorial|

PPT 2007 Charts (part 4)

More two-click adjustments are found when a chart is selected and going to teh LAYOUT tab.

Each of these choices have a drop down to instantly adjust the entire chart. As example, if I want to format the chart legend I SELECT the chart >> LAYOUT tab >> LABELS section >> click LEGEND >> CHOOSE from any of these formatting options:

It is just as easy to adjust the data labels, axes, gridlines and more!

– Troy @ TLC

By |2016-11-17T13:20:08-07:00March 17th, 2008|PowerPoint, Tutorial|

PPT 2007 Charts (part 3)

In earlier versions you could adjust the formatting of the chart, but it required a lot of clicks. Now when a chart is selected the DESIGN tab has a host of formatting tools!

One option is the ability to adjust the entire layout and visible elements with two clicks – 1. Choose layout options, 2. Choose layout:

I was able to adjust the layout and visible elements of the sample chart to each of these layouts with 1 click!

– Troy @ TLC

By |2016-11-17T13:20:33-07:00March 14th, 2008|PowerPoint|

PPT 2007 Charts (part 2)

One of the biggest improvements for charts comes in the ability to update them more effortlessly. No need to double-click the chart, right-click the area to format and then work through a series of dialog boxes.

With PPT 2007 just select the chart, go to >> DESIGN tab >> Chart Styles section.

By choosing one of the options the color scheme and style of visual effects are instantly updated!

In using this feature it is helpful to understand how it is designed:
1. The horizontal shows all of the color options. Colors are based on the Theme Colors (think template color scheme).
2. The vertical starts with simple visual layout at the top and progressively adds more visual effects as you go down.

Troy @ TLC

By |2016-11-17T13:21:00-07:00March 12th, 2008|PowerPoint, Tutorial|

PPT 2007 Charts (part 1)

The visual capabilities of the new Office 2007 are fantastic and when it comes to the mundane chart – the better graphics really help!

PPT2003:
Here I have really worked with the graphic options to create a nice, professional chart.

PPT2007
Here I have the same chart and same data, but with a few clicks I have added some graphic appeal (many of the subtle visual effects are lost in the small image here).

– Troy @ TLC

By |2016-11-17T13:21:21-07:00March 10th, 2008|PowerPoint, Tutorial|

Do You Use PPTs Native Org Chart Tools?

I know a lot of presentations need organization charts. I know a lot of people design their org charts with PowerPoints native org charting tools. I also know a lot of people that are very frustrated while editing these org charts!

Thanks to “Mary” who replied to a post on the MS PowerPoint Forum and provided a link to a great tutorial on ways to modify PPT developed org charts. Click here to open the “Add a second top-level box to an org chart in PowerPoint” tutorial on the Microsoft website.

– Troy @ TLC

By |2016-11-17T15:37:41-07:00February 7th, 2007|Software/Add-Ins|
Go to Top