More two-click adjustments are found when a chart is selected and going to teh LAYOUT tab.
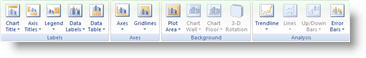
Each of these choices have a drop down to instantly adjust the entire chart. As example, if I want to format the chart legend I SELECT the chart >> LAYOUT tab >> LABELS section >> click LEGEND >> CHOOSE from any of these formatting options:
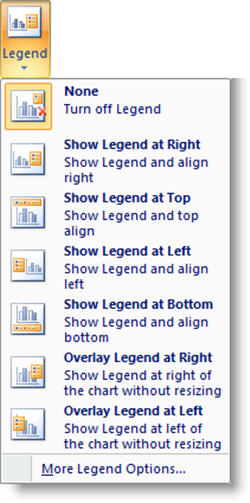
It is just as easy to adjust the data labels, axes, gridlines and more!
– Troy @ TLC