One of the biggest improvements for charts comes in the ability to update them more effortlessly. No need to double-click the chart, right-click the area to format and then work through a series of dialog boxes.
With PPT 2007 just select the chart, go to >> DESIGN tab >> Chart Styles section.

By choosing one of the options the color scheme and style of visual effects are instantly updated!
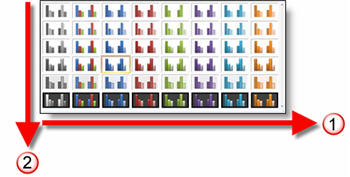
In using this feature it is helpful to understand how it is designed:
1. The horizontal shows all of the color options. Colors are based on the Theme Colors (think template color scheme).
2. The vertical starts with simple visual layout at the top and progressively adds more visual effects as you go down.
Troy @ TLC