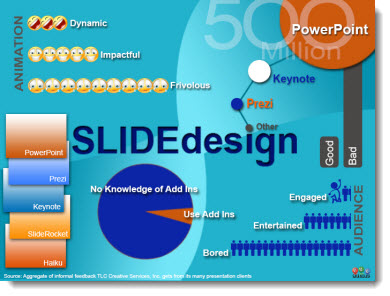
Slide Design InfoGraphic
In developing our newly designed website, which is finally live, we created some graphics to accent the text. This is one example that TLC staff designer Jennifer developed specific for the website.
Note: This is full of fun, non-sourced, completely made up statistics (okay, they are based on my opinion of the slide design world…). But it is real Infographic design.
– Troy @ TLC
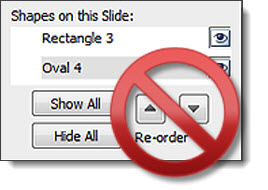
PowerPoint 2013 Selection Pane – Drag and Drop!
PowerPoint 2007 introduced the much needed Selection Pane feature. PowerPoint 2013 has added another much needed feature to the Selection Pane – drag and drop to reorder!
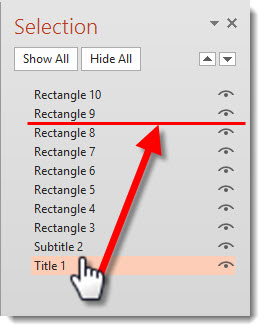
The repeated clicking the up/down arrows to move objects to the front or back (z order) is happily now updated with the ability to select, drag, reposition (yay!).
– Troy @ TLC
Staffing a Live Event
For the past 2 weeks, the TLC Creative office has been virtually empty (thanks Josh and Kristen for staying on top of everything!) as 5 of us were onsite designing presentations, handling rehearsals and running show presentations with the AV crew(s).
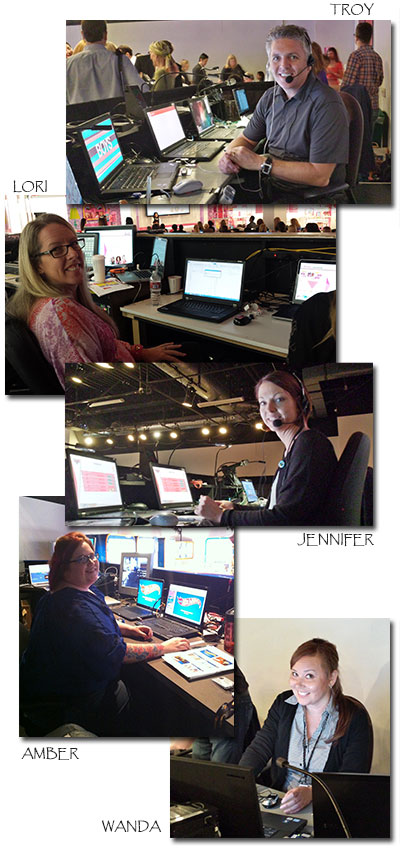
– Troy @ TLC
Mac Keynote Sample – Toyota
Does TLC Creative Services use Keynote? That is a question I hear from many new clients. Of course we do! Presentation design, with any of the available presentation software options, has the same design principles to engage the audience. Some of the technology and visual effects change, but the layout, messaging and use of animation “rules” remain the same.
We have recently added a video of a Keynote presentation project to our portfolio section. TLC Creative Services developed the template, did lots of custom Photoshop work to bring the provided script to life using the unique capabilities of the Apple’s Keynote app. See it here.

– Troy @ TLC
New TLC Website is Live!
It is busy here at TLC Creative, but thanks to a lot of super HTML coding and Word Press design over the past few months (great job making sense of all my notes and requests Amber!) the new TLC Creative Services website is finally ready for use! Okay, 90% of the site is ready, so just ignore any lorem ipsum text or “coming soon” sections…
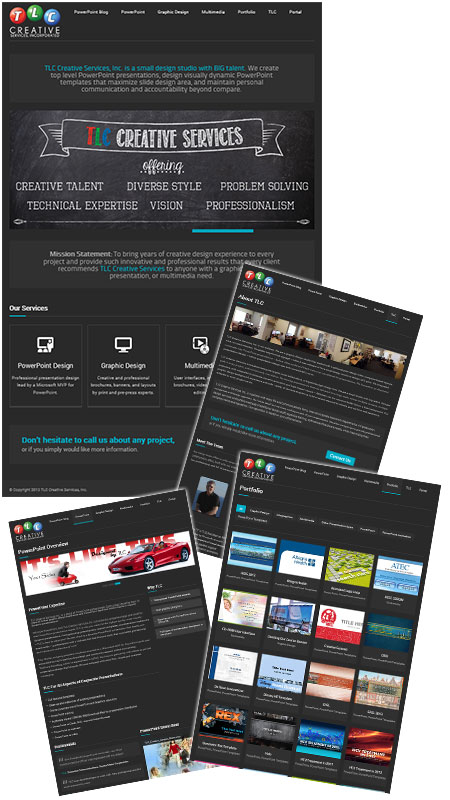
The previous TLC Creative Services website was developed almost 9 years ago (a lifetime on the web!) and this is a wonderful step forward in design, coding and information. Check back as this is phase 1, with another big phase being finished in a few months with lots of PowerPoint tutorials and information being added, then integrating ThePowerPointBlog.com directly into the site by the end of the year, and ongoing updates to the portfolio samples.
– Troy @ TLC
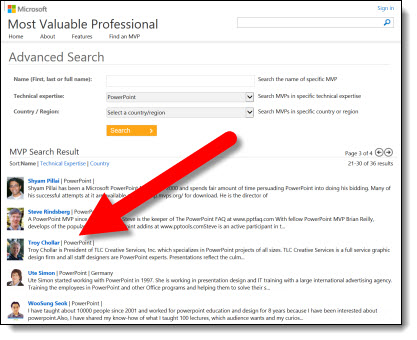
Microsoft MVPs – How Many Are Out There???

All of the current Microsoft MVPs, for every application and from every part of the world are listed here: https://mvp.microsoft.com/en-us/find-an-mvp.aspx
Microsoft’s description of the MVPs is something I like:
“Being an MVP – MVPs represent the best and brightest in technical communities, generously sharing their deep knowledge and hands-on expertise with people around the world.”
But how many MVPs are there, and for how many specialties? Here is the current break down (and I am one of the 10 MVPs (35 worldwide) for PowerPoint):
USA
– Access (36)
– Consumer Security (28)
– Excel (25)
– Info Path (4)
– Internet Explorer (8)
– Office for Mac (5)
– Office Systems (4)
– OneNote (2)
– Outlook (7)
– PowerPoint (10)
– Project (13)
– Publisher (1)
– Visio (3)
– Windows Phone Consumer (6)
– Windows Phone Development (7)
– Word (4)
– Xbox (21)
Worldwide
– Access (58)
– Consumer Security (76)
– Excel (118)
– Info Path (9)
– Internet Explorer (45)
– Office for Mac (9)
– Office Systems (35)
– OneNote (3)
– Outlook (16)
– PowerPoint (35)
– Project (56)
– Publisher (1)
– Visio (15)
– Windows Phone Consumer (16)
– Windows Phone Development (37)
– Word (22)
– Xbox (44)
Countries:
Argentina, Australia, Austria, Bangladesh, Belgium, Brazil, Canada, Chile, China, Denmark, Egypt, Finland, France, Germany, India, Indonesia, Israel, Italy, Japan, Korea, Malaysia, Mexico, Netherlands, New Zealand, Norway, Pakistan, Portugal, Russia, Saudi Arabia, Singapore, South Africa, Spain, Sri Lanka, Sweden, Switzerland, Thailand, Turkey, United Kingdom, United States
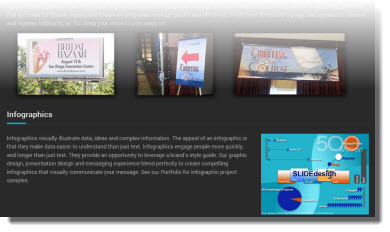
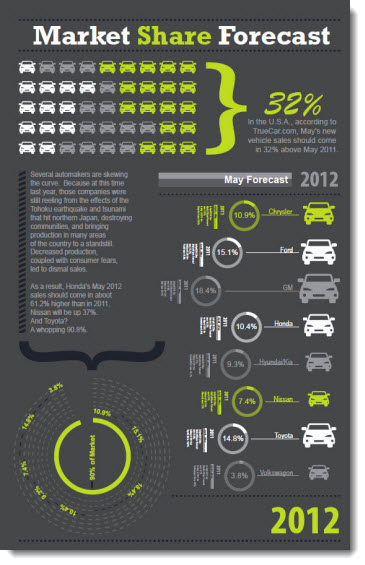
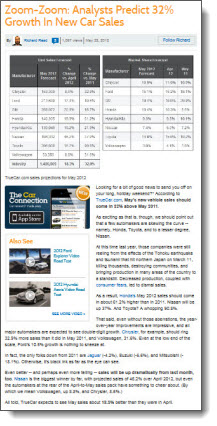
Infographic on Car Forecast
Here is another example of an infographic TLC developed. The overall goal was to pull the information from a written piece and put it into a visual format.
Truecar.com published new statistics regarding the market share forecast for automotive sales growth over the past year. The story lists the statistics; however, they do it in a way that requires you to read the entire article to understand the numbers. Using the article for our source, we created an infographic and pulled out the key data from the article to create a visual representation of the data. Using icons, bars, and charts the data can be displayed in a variety of ways that are interesting as well as informative.
(infographic of information)
(original written story format)
– Troy @ TLC