PowerPoint

Auto Scaling Charts and Font Issues

Sometimes features go missing in newer versions of software. In PowerPoint, the “AUTO SCALE” feature for chart text disappeared after PPT 2003.

Charts in PPT 2003 have an Auto Scale font feature for chart axis’ (checked on by default) that allows the font to scale to the chart when the chart is resized.

The font stays in scale to the chart when the chart is enlarged or reduced in size.

Charts in PPT 2010 do not have the auto scale font feature. When the charts are resized, the fonts stay the same size and get cut off or removed. You have to select the axis and increase or decrease the font manually.

In PPT 2003, however, when the lock aspect ratio for the chart is turned off, and the chart is stretched, the chart becomes distorted.

But in PPT 2010, when the charts are stretched horizontally or vertically, they do not distort.

AUTO SCALE, we miss you!

– Troy @ TLC

By |2016-08-16T09:02:23-07:00October 19th, 2012|PowerPoint, Resource/Misc|

Help – This Shape is Stuck in the Chart

There is a good reason for this feature, but for most it seems to be bug. Which is it, depends on your preference.

Here is the scenario. A chart is on a slide:

With the chart selected, you decide to add a callout box to highlight the import data point in the cart.

The new shape is inserted, but within the chart boundaries. Note: The chart is still selected while the shape is selected.

The new callout shape can be edited and moved – but it can only move within the chart boundaries.

The newly inserted shape has become part of the chart. If the chart is moved, the shape moves. If the chart is deleted, the shape is deleted. But the shape does not interact with the chart, the chart styling options do not change the new shape, and the chart animations do not animate the new shape. For some, this is a feature (ability to tie new shapes to a chart). For others, it is a bug (they did not want the shape tied to the chart).

If you want the shape outside of the chart, the easiest fix is to select the shape (select the chart, then select the shape in the chart) >> copy >> delete >> unselect the chart >> paste.

Now the slide has a chart and a separate shape.

– Troy @ TLC

By |2016-08-16T09:07:54-07:00September 19th, 2012|PowerPoint, Tutorial|

PPT 2013 – Improved Presenter Notes

Okay, the title is a bit misleading for this one. It is not so much the presenter notes that are improved, but rather the way you open/close the presenter notes.

Here is my sample slide, which is not showing the Presenter Notes:

New in PPT 2013 is the addition of a NOTES button on the bottom of the UI.

Click the NOTES button and the Presenter Notes open – no need to fiddle with positioning the cursor and getting the double arrow cursor so you can click and drag to raise up and open the Presenter Notes.

Here is a video of the NOTES button in action
[youtube src=”https://youtube.com/embed/pr5op_ibccE?rel=0″]

– Troy @ TLC

By |2016-08-16T09:10:22-07:00August 31st, 2012|PowerPoint|

PPT 2013 – Resume Viewing When Reopening Presentation

This is a nice addition to PowerPoint and a really well planned and implemented function – Resume.

Here is a presentation for a recent project. Note it has 14 slides.

Before closing the presentation, I am on slide #5.

When I reopen the presentation:
1. I am always viewing slide #1.
2. I have a message on the scroll bar informing me of the last slide I was looking at before the presentation was closed, along with the date and time.

I can choose to work on slide 1, manually go to any slide in the deck, or click the RESUME box and automatically be taken to that slide – in this case, slide #5

– Troy @ TLC

By |2016-06-23T13:56:26-07:00August 29th, 2012|PowerPoint|

PPT 2013 – Shape Combine Tools

PowerPoint 2007 improved the shape edit tools – ie. Bezier lines (see this Aug. 2009 blog post). While not perfect and very simple – compared to “real” vector editing applications like Adobe Illustrator – they were a great addition to PowerPoint and made lots of design needs available inside PowerPoint.

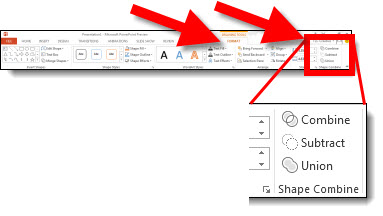
PowerPoint 2010 added another shape edit toolset called “Combine Shape.” They were a great move forward in developing custom vector images inside PowerPoint. But, the real issue was no one knew the tools were there as you had to manually add them to the ribbon. For PowerPoint 2013, Microsoft has “surfaced the feature” – which means it is now on the ribbon by default.

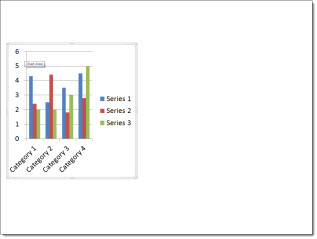
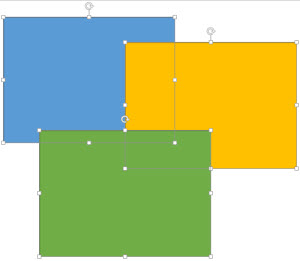
But the default ribbon tools in the “Shape Combine” section do not offer all of the tools – including a new feature that is great! Here is my sample slide with 3 rectangles.

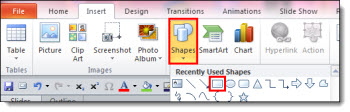
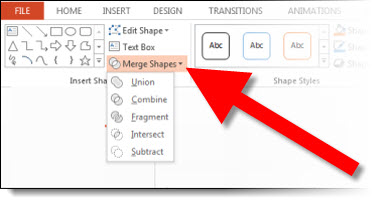
I am going to access the Shape Combine tools using the MERGE SHAPES drop down menu on the Format tab.

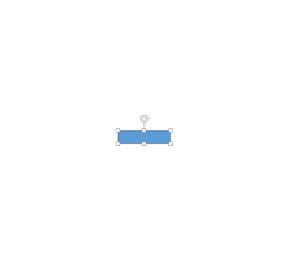
First up is the UNION tool, which takes all 3 selected shapes and creates 1 custom shape (Note: The blue shape was the first selected, so the new shape uses its styling):

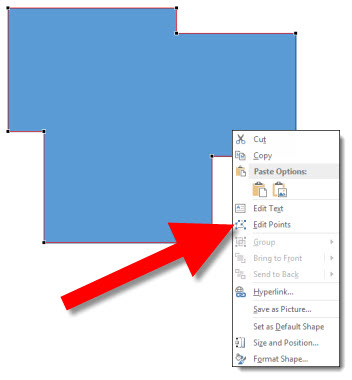
When you edit this new shape, each corner is editable over the single custom shape:

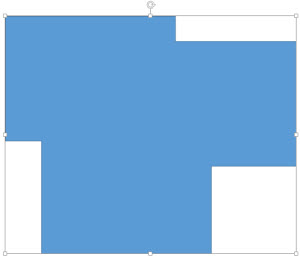
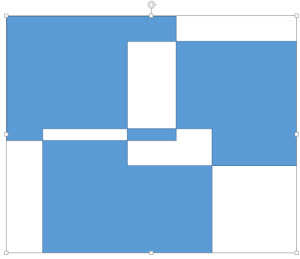
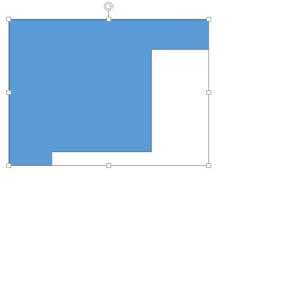
Second option in the MERGE SHAPES is the COMBINE tool. This is 1 shape again, but identifies the overlapping sections and knocks them out to create a unique shape:

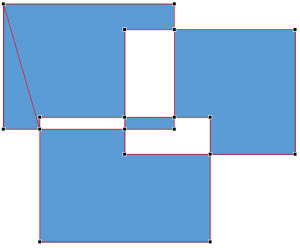
Again, when you edit this shape with the EDIT POINTS, it is a single image, with each corner an editable point – and a few unusual edit points:

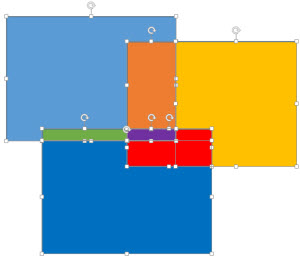
Third in the menu is something new – FRAGMENT. This has some real power and will eliminate many trips to Adobe Illustrator or lots of time using PowerPoint’s Edit Points tool to create custom shapes. Every overlapping section becomes a unique shape. I quickly selected each and added different fill colors for each to make it easy to see the result.

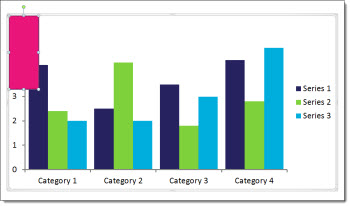
INTERSECT is next and it identifies the overlapping sections where all selected shapes overlap and removes all but the overlap:

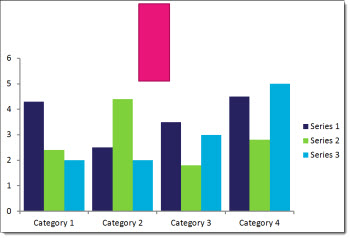
And last in the Merge Shapes menu is SUBTRACT which again identifies all of the overlap sections and based on the first shape selected deletes the overlaps:

So if you did not know of the Shape Combine tools in PPT 2010, or if you have used them and now are excited about the FRAGMENT tool, PowerPoint 2013 is certain to prove more powerful in creating custom shapes!

– Troy @ TLC

By |2016-08-16T09:11:36-07:00August 27th, 2012|PowerPoint|

PPT 2013 – Datasheet is Back!

I admit, I am not a number person. That also means I am not an Excel person. So when PPT 2007 came out and the simple Datasheet editing of chart data was replaced with a full Excel experience, I was not the happiest designer in the building. Of course, in the long run, it has forced me to face Excel much more and become much more proficient with it.

Now, with PPT 2013, it the best of the old and new! Insert or edit a chart and PowerPoint offers the nice, simple and easy to use Datasheet.

But this is not the Datasheet of old. It is more like Excel Lite, as it is not an independent application like the legacy version, but a simplified Excel editing window. So, if you love Excel, or need more functions than the Datasheet offers, just click the Excel icon.

Now the chart data is being edited in the full Excel experience.

– Troy @ TLC

By |2016-08-16T09:12:38-07:00August 24th, 2012|PowerPoint|

PPT 2013 – Comments

Comments, notes from a reviewer to the presenter or presentation designer, have been a feature of PowerPoint for several versions. With PPT13, the comments interface gets a makeover and greatly enhances their usability.

Along the bottom of the UI is a new “Comments” button.

Click the “Comments” button and a new information pane opens that is a central information area for all comments in the presentation.

1. Add a new comment to a slide with this button.
2. To go to the previous or next comment use these buttons. This will automatically jump slides as needed.
3. Each comment shows who authored the comment, the date/time it was added, their comment and if they are a contact in your Outlook or Lync with an avatar – it will also show.
4. Reply direct to a comment in the Comments pane.

5. Each comment will show all replies. In addition, the onslide indicator (which is only visible while editing the slides and hidden from view during slide show) stacks to show multiple answers.

The ribbon also has a new section with the Comments tools, all of which can be accessed through the comments pane.

To remove/delete a comment, there are lots of options:
– Click the X next to the comment.
– Right-click the comments icons and select delete.
– On the ribbon in the Comments section, select delete.

I feel this is a great usability advancement for the tool and will go a long way in making this a more common use tool. Also, the comments work in legacy versions (PPT 2010, 2007, 2003) with no problem – but without the new Comnents Pane.

– Troy @ TLC

By |2016-08-16T09:12:56-07:00August 22nd, 2012|PowerPoint|

PPT 2013 – ClipArt is Gone!

The long use name “ClipArt” can easily be argued that it has outlived is namesake. ClipArt has me imagining simple, flat, and generally bad vector images. So, with that image in our mind, it is often difficult to click the INSERT CLIPART button in PowerPoint 2010.

PPT 2013 has progressed and the “Insert ClipArt” button has been replaced with “ONLINE PICTURES”

The “Online Pictures” button brings up a new dialog. The “Office.com” search goes to the same image catalog as the previous “Insert Clipart” function. The Bing Image Search is a nice addition to have work directly in PPT. And the options can be customized to your workflow. The Public Beta links to a Skydrive account, Office 365 account, Flickr – and the future should offer us many more options as third party companies add the coding to tie in with Office 2013!

– Troy @ TLC

By |2016-08-16T09:13:26-07:00August 20th, 2012|PowerPoint|

PPT 2013 – Motion Paths

The Motion Path tool has the same features – ie. no changes to the type of motion paths or how they are executed. But there is a big change in the editing functionality.

Here is my slide with a Motion Path applied to the car image.

Selecting the object (the car image in this demo) is all the same functionality.

But when the actual Motion Path line is selected (ie. the dotted line), a ghosted (semi-transparent) image in the end position is seen!

This is a great function addition to this tool.

Note: If you work with Motion Paths, in any version of PPT, I highly recommend the free Motion Path Tools add-in here.

– Troy @ TLC

By |2016-08-16T09:14:23-07:00August 17th, 2012|PowerPoint|

PPT 2013 – Equidistant with the New Smart Guides

Smart Guides were introduced in PowerPoint 2010 and are a great feature. PowerPoint 2013 has made the good tool even more usable. Smart Guides can now visually show when shapes are equally spaced apart from one another.

This feature is easier to see than explain, so here is a demo showing 6 boxes being aligned and equally spaced (and another great selection of background music).
[youtube src=”https://www.youtube.com/embed/vZmppYSsuhI?rel=0″]

– Troy @ TLC

By |2016-08-16T09:14:48-07:00August 15th, 2012|PowerPoint|
Go to Top