The PowerPoint® Blog

I work with PowerPoint on a daily basis and I am very honored to be a Microsoft PowerPoint MVP. We have a talented team of presentation designers at TLC Creative Services and ThePowerPointBlog is our area to highlight PowerPoint tips, tricks, examples and tutorials. Enjoy! Troy Chollar

Align Objects Within Objects

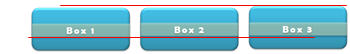
The eye perceives when things are out of balance, even if the brain cannot identify the cause of it. This is even more evident when the slides are projected on a large screen. Take these images for example:

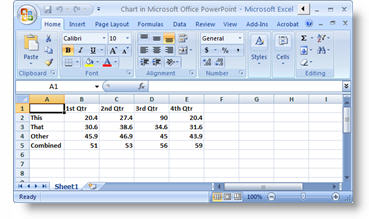
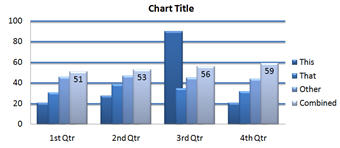
First, let’s look at how I made these elements. Each consists of two PPT autoshapes, a rounded corner box and a text box with a semi-transparent fill.

So what’s wrong with them? The left box’s text box is a few pixels lower than the others. The right rounded corner box is a few pixels higher than the others.

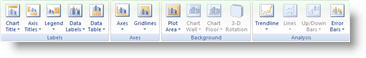
To fine tune this set of objects I would first select the 3 text boxes and use the ALIGN MIDDLE tool to have them all vertically line up – to the pixel. I would then do the same thing by selecting the 3 rounded corner boxes.

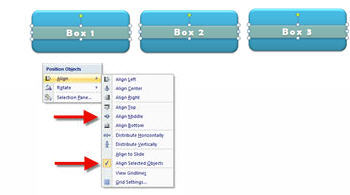
The end result is something that is in balance – and your eyes know it (or at least do not focus on it).

– Troy @ TLC

By |2016-11-17T13:16:58-07:00March 26th, 2008|PowerPoint, Tutorial|

Vector Magic (Update)

A few weeks back I posted a tutorial on the Vector Magic website/application (converts raster artwork to editable vector graphics). There are lots of visitors to ThePowerPointBlog, and I am sure many went and checked it out – but don’t blame me…

Vector Magic has gone from free to a pay system… Still an incredible application which can easily compete with, and in many aspects out perform Illustrator C3’s vectorize feature. Everyone just has to pay now.

– Troy @ TLC

By |2016-11-17T13:29:38-07:00March 24th, 2008|Resource/Misc|

PPT 2007 Charts (part 6)

No more importing an Excel chart and not having it play nice with PowerPoint. All of Offices uses a single charting engine, so a chart can be designed in Excel, Word or PowerPoint and be used (and edited) in all three with no issues.

When you go to format a “PowerPoint” chart is now opens an excel window with the data. Here is the data used to create the sample chart for this series.

– Troy @ TLC

By |2016-11-17T13:19:12-07:00March 21st, 2008|PowerPoint, Tutorial|

PPT 2007 Charts (part 5)

Individual elements can also be adjusted not only with easy, but using the new visual effects. Here I am selecting the horizontal gridlines of the chart. I can go to FORMAT >> SHAPES STYLES >> and choose any of the preset effects and colors:

Just like earlier the horizontal options are the colors from the Theme. The vertical options progress from simple/flat to rich/beveled designs.

With just a few clicks the gridlines can easily be updated to these:

– Troy @ TLC

By |2016-11-17T13:19:47-07:00March 19th, 2008|PowerPoint, Tutorial|

PPT 2007 Charts (part 4)

More two-click adjustments are found when a chart is selected and going to teh LAYOUT tab.

Each of these choices have a drop down to instantly adjust the entire chart. As example, if I want to format the chart legend I SELECT the chart >> LAYOUT tab >> LABELS section >> click LEGEND >> CHOOSE from any of these formatting options:

It is just as easy to adjust the data labels, axes, gridlines and more!

– Troy @ TLC

By |2016-11-17T13:20:08-07:00March 17th, 2008|PowerPoint, Tutorial|

PPT 2007 Charts (part 3)

In earlier versions you could adjust the formatting of the chart, but it required a lot of clicks. Now when a chart is selected the DESIGN tab has a host of formatting tools!

One option is the ability to adjust the entire layout and visible elements with two clicks – 1. Choose layout options, 2. Choose layout:

I was able to adjust the layout and visible elements of the sample chart to each of these layouts with 1 click!

– Troy @ TLC

By |2016-11-17T13:20:33-07:00March 14th, 2008|PowerPoint|

PPT 2007 Charts (part 2)

One of the biggest improvements for charts comes in the ability to update them more effortlessly. No need to double-click the chart, right-click the area to format and then work through a series of dialog boxes.

With PPT 2007 just select the chart, go to >> DESIGN tab >> Chart Styles section.

By choosing one of the options the color scheme and style of visual effects are instantly updated!

In using this feature it is helpful to understand how it is designed:
1. The horizontal shows all of the color options. Colors are based on the Theme Colors (think template color scheme).
2. The vertical starts with simple visual layout at the top and progressively adds more visual effects as you go down.

Troy @ TLC

By |2016-11-17T13:21:00-07:00March 12th, 2008|PowerPoint, Tutorial|

PPT 2007 Charts (part 1)

The visual capabilities of the new Office 2007 are fantastic and when it comes to the mundane chart – the better graphics really help!

PPT2003:
Here I have really worked with the graphic options to create a nice, professional chart.

PPT2007
Here I have the same chart and same data, but with a few clicks I have added some graphic appeal (many of the subtle visual effects are lost in the small image here).

– Troy @ TLC

By |2016-11-17T13:21:21-07:00March 10th, 2008|PowerPoint, Tutorial|

So that’s what I do!

Not long ago I received this position description for a ‘Senior PowerPoint Artist’ from a tech recruiting company. Of course at this stage in my career my resume is this blog, my website and the referrals of others (eg. I do not have a resume). So it was informative to see in writing what it is I actually do!

– Troy @ TLC

—————————————-

Looking for a PowerPoint artist to work with top executives.
– support senior executives in powerpoint.
– high-level skills in photoshop and powerpoint
– good at conceptualizing and creating these concepts into slides
– thorough understanding on the animation function in powerpoint
– good communication skills, will interact with upper management
– must be fast, and understand technology
– PC user

Overview:
The PowerPoint Artist is responsible for the consistent implementation and creation of the visual identity system in executive presentations.

Strong graphic designs skills a must. Senior-level demonstrable problem solving skills and proven ability to quickly produce multiple ideas to meet client requests. Strong communication skills required, as is ability to work effectively with direct outside design and production vendors.

Ability to conceptualize as well as execute creative ideas is critical. Strong freehand drawing and computer rendering skills are required to effectively communicate with both client and vendors. Knowledge of image manipulation required, as is a digital portfolio demonstrating expertise in PowerPoint, Adobe Illustrator, Adobe Photoshop and other standard graphics software packages.

Exceptional teamwork and customer service skills required. Ability to design within the confines of the company’s Brand Identity system.

Essential Qualifications:
4-6 years High-tech Corporate Communications experience

Education:
B.A./B.S. Graphic Design

Relevant experience/skills:
Knowledge of PC computer systems required.

Successful candidate will embrace change, be comfortable in meetings and discussions, and have a passion for working cross-functional. Candidate should be a strong listener, adapt easily to change. Candidate should be able to work with little supervision and have the ability to consult and influence with all levels of management within company and its partners.

By |2016-11-17T13:21:59-07:00March 7th, 2008|Personal|
Go to Top